

Singapore’s residential property market lost some pace in the second quarter of 2026, but slower is not the same as weaker.
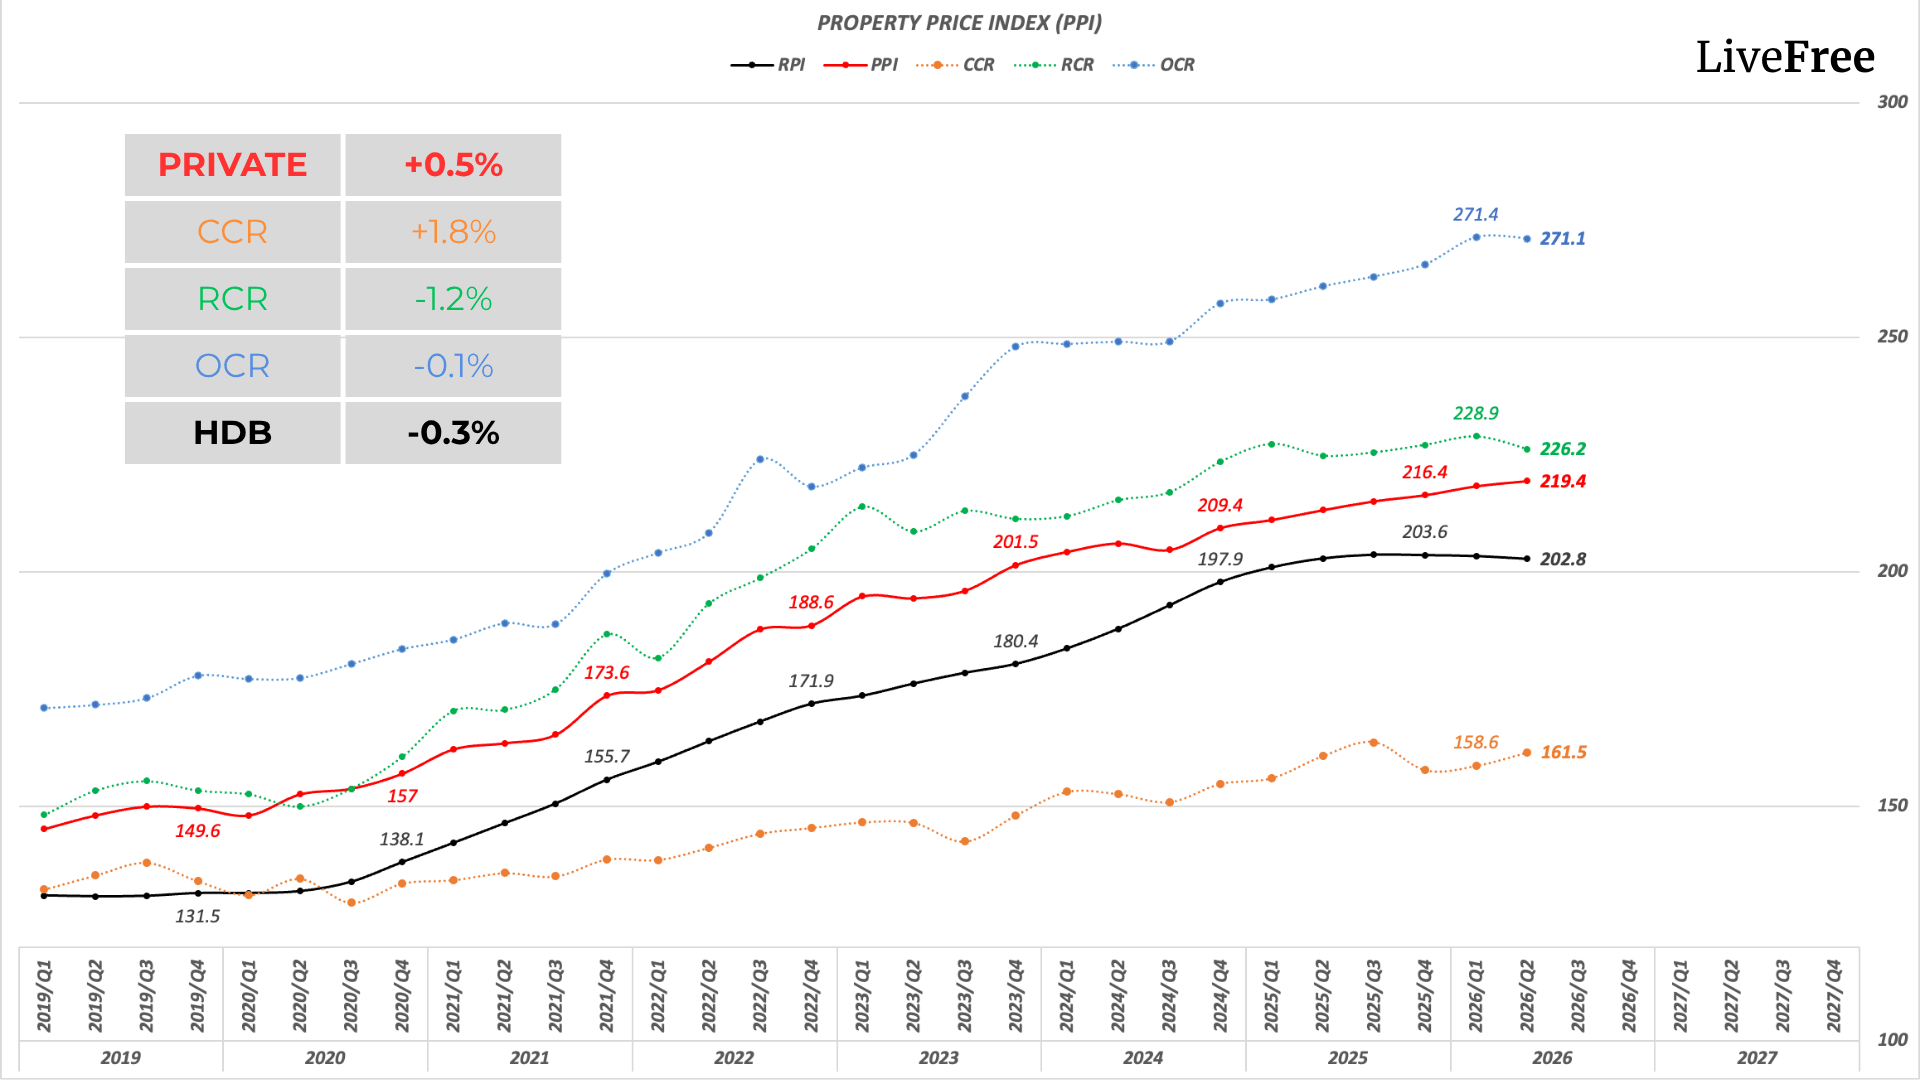
According to URA’s 2Q2026 statistics, the overall private residential price index rose by 0.5%, roughly half the 0.9% increase in 1Q2026. This brings the cumulative increase for the first half of 2026 to 1.4%, trailing the 1.8% gain recorded in H1 2025.
This gives us a clearer view of the Singapore property market outlook for the second half of 2026. At the same time, the data shows the regional story has flipped almost completely from the previous quarter. Landed properties rebounded 2.5%, after dipping 0.4% in 1Q2026, while non-landed private homes slipped 0.1% overall. Within non-landed private property, CCR led growth at +1.8%, while RCR fell -1.2% and OCR was flat at -0.1%.
The strongest reversal in 2Q2026 came from the Core Central Region. CCR non-landed prices rose 1.8% in the quarter, up from 0.6% in 1Q2026, marking a real re-acceleration in the segment that had lagged the broader market for over a year.
This does not mean every prime district launch will perform well. Instead, it tells us pricing power is returning to the core, and buyers weighing a city-fringe unit against a suburban one now face a narrower entry price gap than they did a quarter ago. RCR moved in the opposite direction, falling 1.2% after rising 0.8% in 1Q2026, and OCR, last quarter’s strongest performer at +2.2%, came in essentially flat at -0.1%.
We do not read the OCR number as a loss of demand. Fewer new OCR launches reached the market this quarter, which means fewer high-water-mark transactions to pull the index up. A handful of well-received CCR launches did the opposite job on the other end of town.
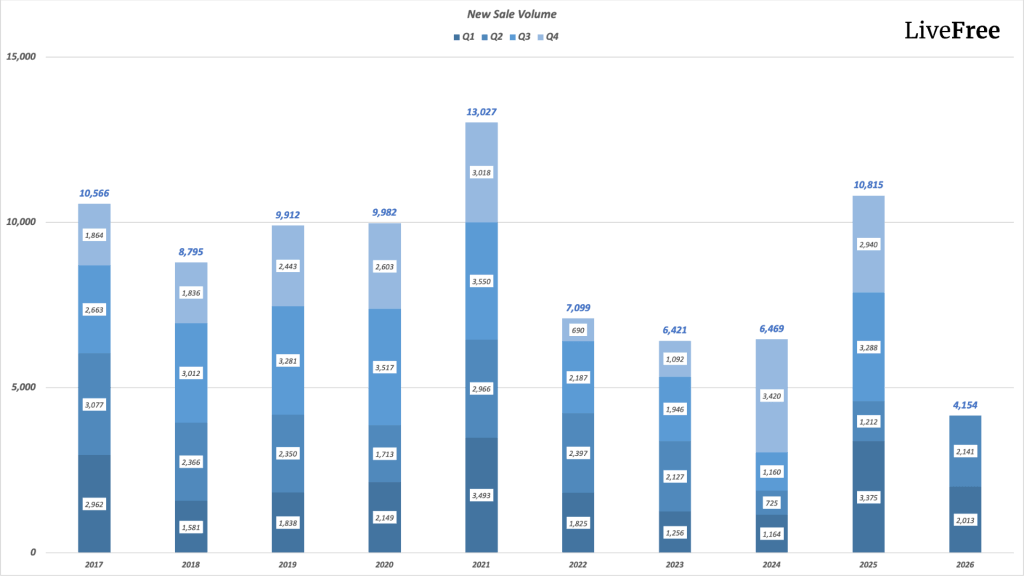
Developers sold 2,141 new private homes excluding ECs in 2Q2026, a modest step up from 2,013 units in 1Q2026. Executive condo sales told a different story: just 175 EC units were sold, down sharply from 1,168 in the previous quarter.
This is important because the EC figure is a launch calendar effect, not a demand signal. 1Q2026 benefited from a major EC launch; 2Q2026 simply did not have an equivalent one on the calendar. Watching this segment for buyer sentiment will require waiting for the next EC launch rather than reading too much into this quarter’s volume alone.
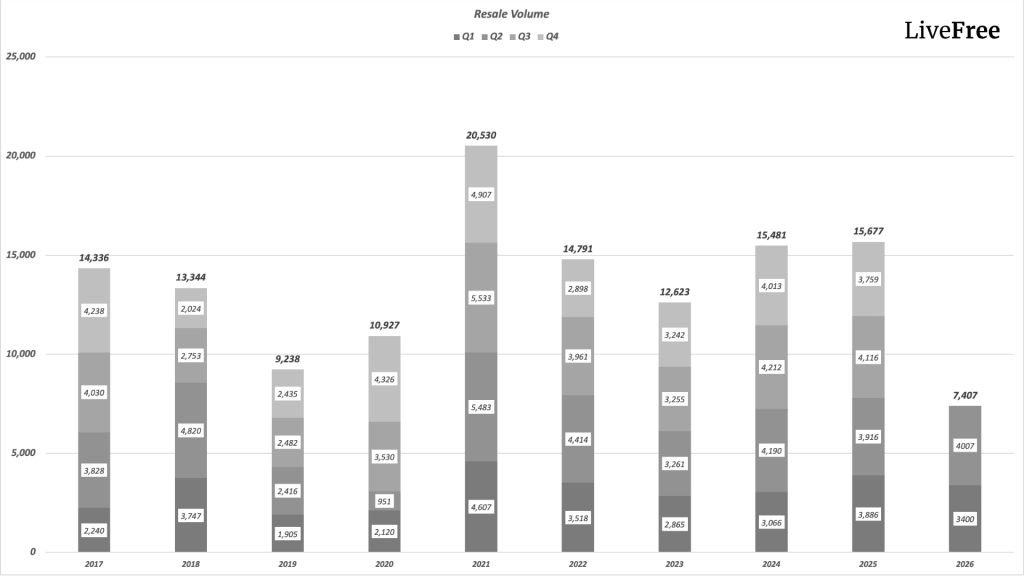
Private resale transactions came in at 3,813 units in 2Q2026, compared with 3,225 in 1Q2026. Resale transactions made up 62.0% of all private residential sale transactions, up from 59.6% in the previous quarter, the largest resale share of total transactions in recent memory. Sub-sales also ticked up slightly to 194 units.
This shows that resale homes are playing an even larger role this quarter, especially for buyers who need immediate occupation or a specific location that new launches cannot offer.
However, resale selection becomes more important as this segment grows. Unlike new launches, resale performance is more project-specific: entry price relative to recent transactions, unit layout efficiency, and who the eventual buyer will be still matter more than the headline resale trend.
This shift in resale activity is not happening in isolation. It is closely linked to changes in the HDB market, where a similar rebalancing is underway.
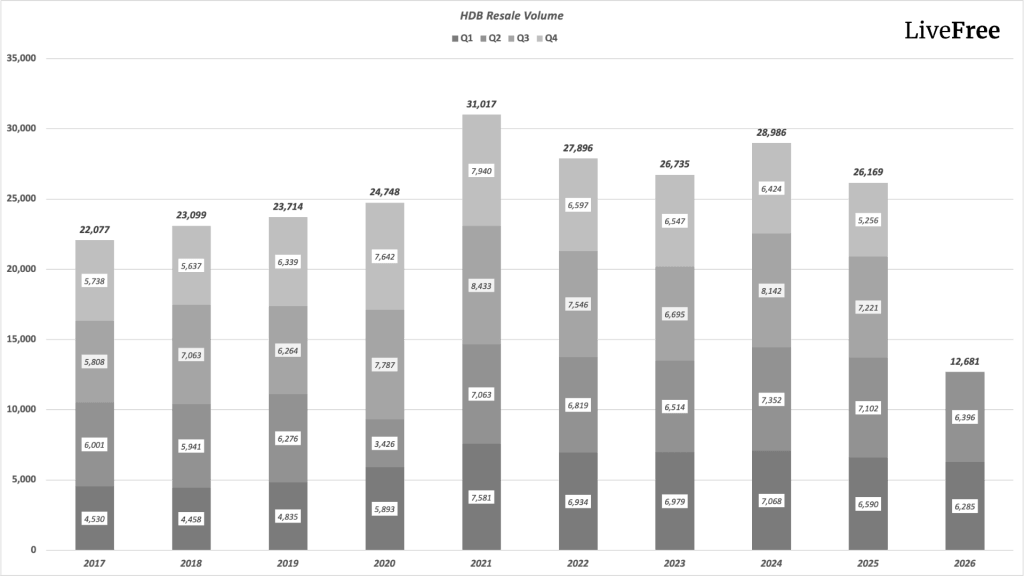
One of the clearest shifts in 2Q2026 is the HDB resale market, where prices softened for a second consecutive quarter, a run the market has not seen since 2019.
HDB resale prices dipped from 203.4 in 1Q2026 to 202.7 in 2Q2026, a 0.3% decline, following 1Q2026’s 0.1% dip. HDB resale volume in 2Q2026 stood at 6,268 transactions, little changed from 6,285 in the previous quarter.
However, this is not a sign of weakening demand. It is a shift in where demand is going, and affordability data helps explain it: 48.2% of resale transactions fell between $500,000 and $750,000, and 22.9% were priced between $250,000 and $500,000. Together, 71.1% of resale flats transacted within a range most middle-income buyers can still stretch to.
In recent quarters, the government has increased the supply of BTO flats, with many projects offering shorter waiting times. At the same time, the price gap between BTOs and resale flats has narrowed over the past few years, after resale prices rose rapidly between 2021 and 2023.
This creates a more balanced market:
As a result, resale demand has softened slightly at the margins, leading to the two-quarter stabilisation we are now seeing. For homeowners, this means the market is still liquid, but no longer in a phase where prices rise every quarter without exception. For upgraders, softer resale pricing with steady volume means less pressure to chase a listing, and more room to negotiate on the way out, provided CPF and loan planning are settled before the next purchase is committed to.
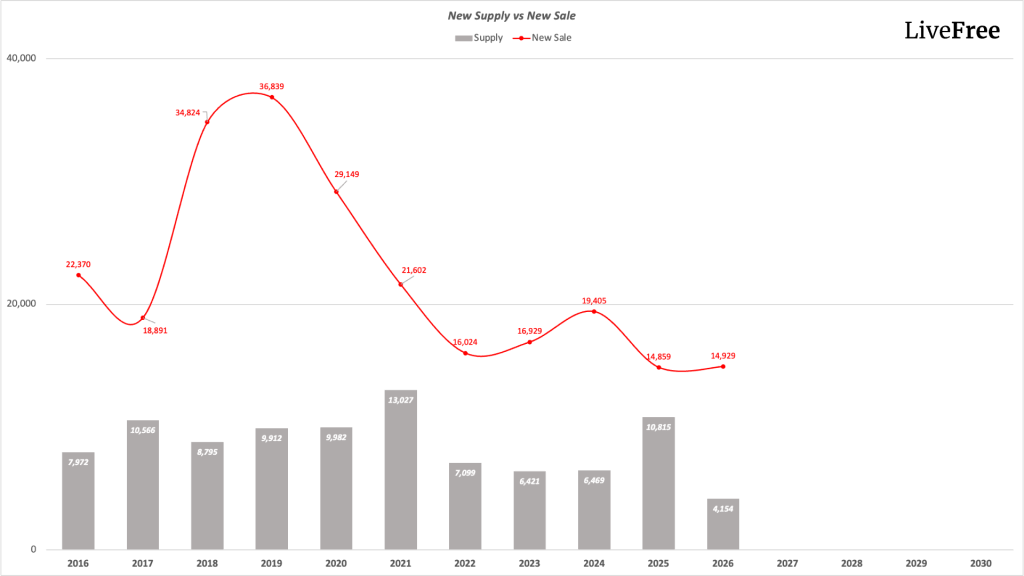
The current pipeline holds 15,810 unsold units with planning approval, with a further 18,153 pending approval, against roughly 60,600 units expected to complete over the coming years. When we compare this against demand, the picture is less tight than it was a year ago, and that is one honest reason price growth is moderating even as transaction volumes hold up.
Rents moved in the opposite direction of prices this quarter. The overall rental index rose 0.7%, up from 0.3% in 1Q2026, with landed rents up a sharp 2.7% and non-landed rents holding a steady 0.4%. Vacancy edged up slightly to 6.4% from 6.2%, with CCR carrying the highest vacancy at 8.3% against RCR’s 6.1% and OCR’s 5.6%.
This is worth sitting with: the prime segment’s price recovery is happening alongside its softest occupancy. Supply is not oversupplied in the way that would call for a correction, but it is loose enough that:
Landed and non-landed rents are climbing faster than sale prices in most segments
CCR’s vacancy rate is running well above the market average, even as CCR prices lead the recovery
Developers are still competing hard for land, betting on demand catching up to today’s completions
| Date | Site | Units | Tenure | Region | District | Type | Developer | Price | # Bids |
|---|---|---|---|---|---|---|---|---|---|
| 7-Apr-26 | Kallang Close (GLS) | 470 | 99 | RCR | 8 | Mixed | Frasers / Mitsubishi | $1,415 | 4 |
| 17-Apr-26 | Loyang Valley (ENBLOC) | 1,200 | 99 | OCR | 17 | Residential | Singhaiyi | $654 | 1 |
| 4-May-26 | Dunearn Road (GLS) | 335 | 99 | CCR | 10 | Mixed | Wingtai / Metrobilt | $1,625 | 6 |
| 12-May-26 | Holland Plain (GLS) | 275 | 99 | CCR | 10 | Residential | Sim Lian | $1,491 | 1 |
| 14-May-26 | Miltonia Close EC (GLS) | 450 | 99 | OCR | 27 | EC | Hoi Hup | $732 | 3 |
| 16-Jun-26 | Peck Hay Road (GLS) | 315 | 99 | CCR | 11 | Residential | CDL / Hong Leong | $1,865 | 4 |
| 18-Jun-26 | River Valley Green C (GLS) | 740 | 99 | CCR | 9 | Residential | Sunway / MCL / CSC | $1,730 | 4 |
Another important signal in 2Q2026 is the strength of Government Land Sales bids, and the money backs it up. Investment sales totalled S$15.02 billion for the quarter, pushing the year-to-date figure past S$35 billion, nearly three times the S$5.95 billion transacted in the same quarter last year. The seven GLS and en-bloc residential sites awarded in 2Q2026 alone accounted for roughly S$4.1 billion of land value, spread across 3,585 future homes.
This is important because land bids reflect what developers believe they can sell at in the future. If developers were expecting a major price correction, we would likely see bidding pull back. Instead, the opposite is happening, with CCR sites in particular drawing intense competition.
Peck Hay Road, District 11, drew four bids and went to a CDL and Hong Leong joint venture at S$542.4 million, or S$1,865 psf ppr, the highest land rate of the quarter. This is one of the clearest signals of renewed confidence in the CCR: a site close to Novena and the city centre, at a price that assumes buyers are willing to pay a genuine premium again.
River Valley Green (Parcel C), District 9, was the quarter’s second-highest bid, awarded to a Sunway, MCL, and CSC consortium at S$750.6 million, or S$1,730 psf ppr, on four bids. At 740 units, this is also the largest CCR site awarded this quarter, and a River Valley address puts it in direct competition with some of the most established addresses in the country.
Miltonia Close, District 27, is the one EC site awarded this quarter, going to Hoi Hup at S$340.85 million, or S$732 psf ppr, on three bids. Coming in the same quarter that EC sales volume fell to just 175 units, this land sale is worth watching. It signals a fresh EC launch is coming, and that could be the catalyst that resets EC demand in late 2026 or 2027.
Loyang Valley, District 17, was the quarter’s largest transaction by unit count at 1,200 homes, sold en bloc rather than through the GLS programme, to Singhaiyi at S$880 million, or S$654 psf ppr, on a single bid. The lowest psf of the quarter by some distance, and a useful reminder that OCR land economics are still a different conversation entirely from what is happening in the core.
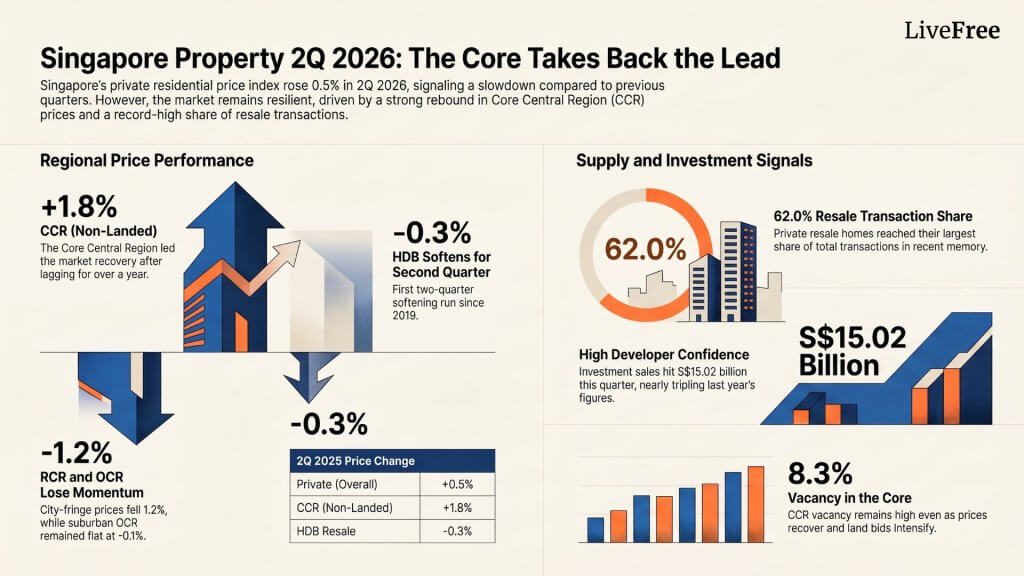
The 2Q2026 data tells us the market has not weakened, but the source of strength has moved.
CCR is regaining pricing power, but that also means the defensible entry price in prime districts just moved up. Buyers eyeing that segment need to be sharper about what they are paying for, not just excited that the region is back. OCR’s flat quarter is not a red flag. It is a pause after an unusually strong run through 2025 and 1Q2026, and much of it comes down to which projects launched when, not a change in who wants to live in the outer regions.
For HDB upgraders, the window is more nuanced. Two consecutive quarters of resale softness gives sellers more room to negotiate on the way out, but that only helps if CPF usage and loan eligibility for the next purchase are mapped out in advance. A good exit price does not rescue a badly sequenced move.
For investors, the key question is no longer just where prices are heading. The widening gap between CCR’s price recovery and its 8.3% vacancy rate is the number to sit with this quarter. Strong land bids signal long-term developer confidence, but near-term rental competition in the core is real, so know your exit audience and your holding power before assuming today’s land bid price tells you tomorrow’s resale value.
Hi 
We offer private property consultations for readers. Interested?