

There is no single best performing district in Singapore, and ten years of resale condo transactions make that plain. District 20 and District 26 led on 10-year price growth, District 27 on the five-year window, while prime districts like D1 and D9 stayed subdued. But price growth alone hides the more useful finding: liquidity decided who could actually realise those gains.
District-level performance is shaped by affordability, supply expansion, buyer depth, resale liquidity and holding behaviour. Those factors do not move together. We analysed a decade of resale transactions across all major districts using URA private residential data, looking at how prices, supply and activity evolved rather than just where prices landed.
Rather than price alone, we scored districts across four dimensions:
The framework shows how districts behave structurally instead of ranking them into winners and losers, and it is why the best performing district changes depending on which dimension you weight.
New launch transactions were left out, since they can inflate prices temporarily without testing long-term buyer support. Districts 6 and 24 were excluded because their housing stock is too small for meaningful comparison.
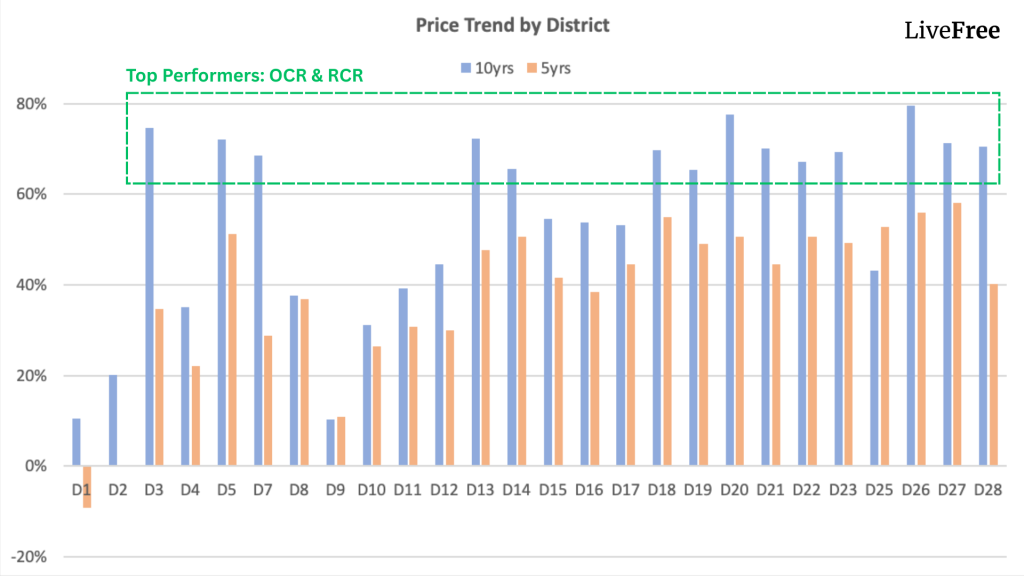
Resale price appreciation over the decade was unevenly distributed, and it was not concentrated in the traditional prime districts. Several OCR and city-fringe districts recorded stronger long-term growth, while some prime districts saw muted appreciation and in certain cases weaker five-year performance.
That does not make any of them the best performing district outright, and it does not mean prime districts underperform structurally. It means different cycles reward different buyer segments, and this cycle rewarded affordability and upgrader participation.
In practice, D20 and D26 recorded among the highest 10-year growth, and D27 stood out over five years. D1 and D9 were more subdued, with outcomes far more sensitive to entry price and timing. The best performing district in this cycle correlated with broad buyer participation rather than address prestige. Our Thomson Reserve review shows what that looked like inside D20.
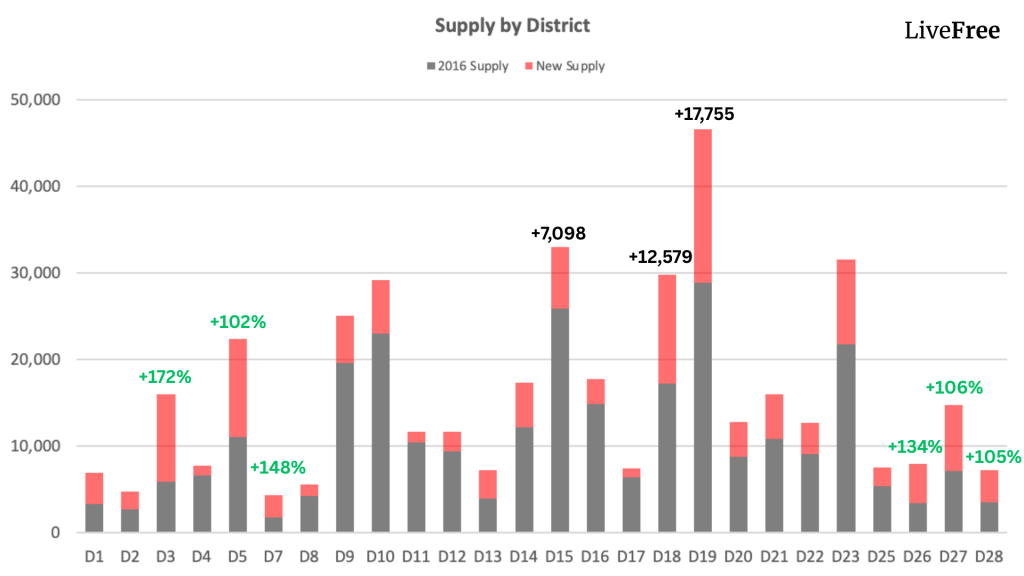
The common assumption is that large supply injections suppress prices. It can happen, but not consistently. Several districts absorbed substantial supply increases while resale prices kept rising, because that supply met sustained owner-occupier demand, tenant-to-owner conversions and local upgrader movement.
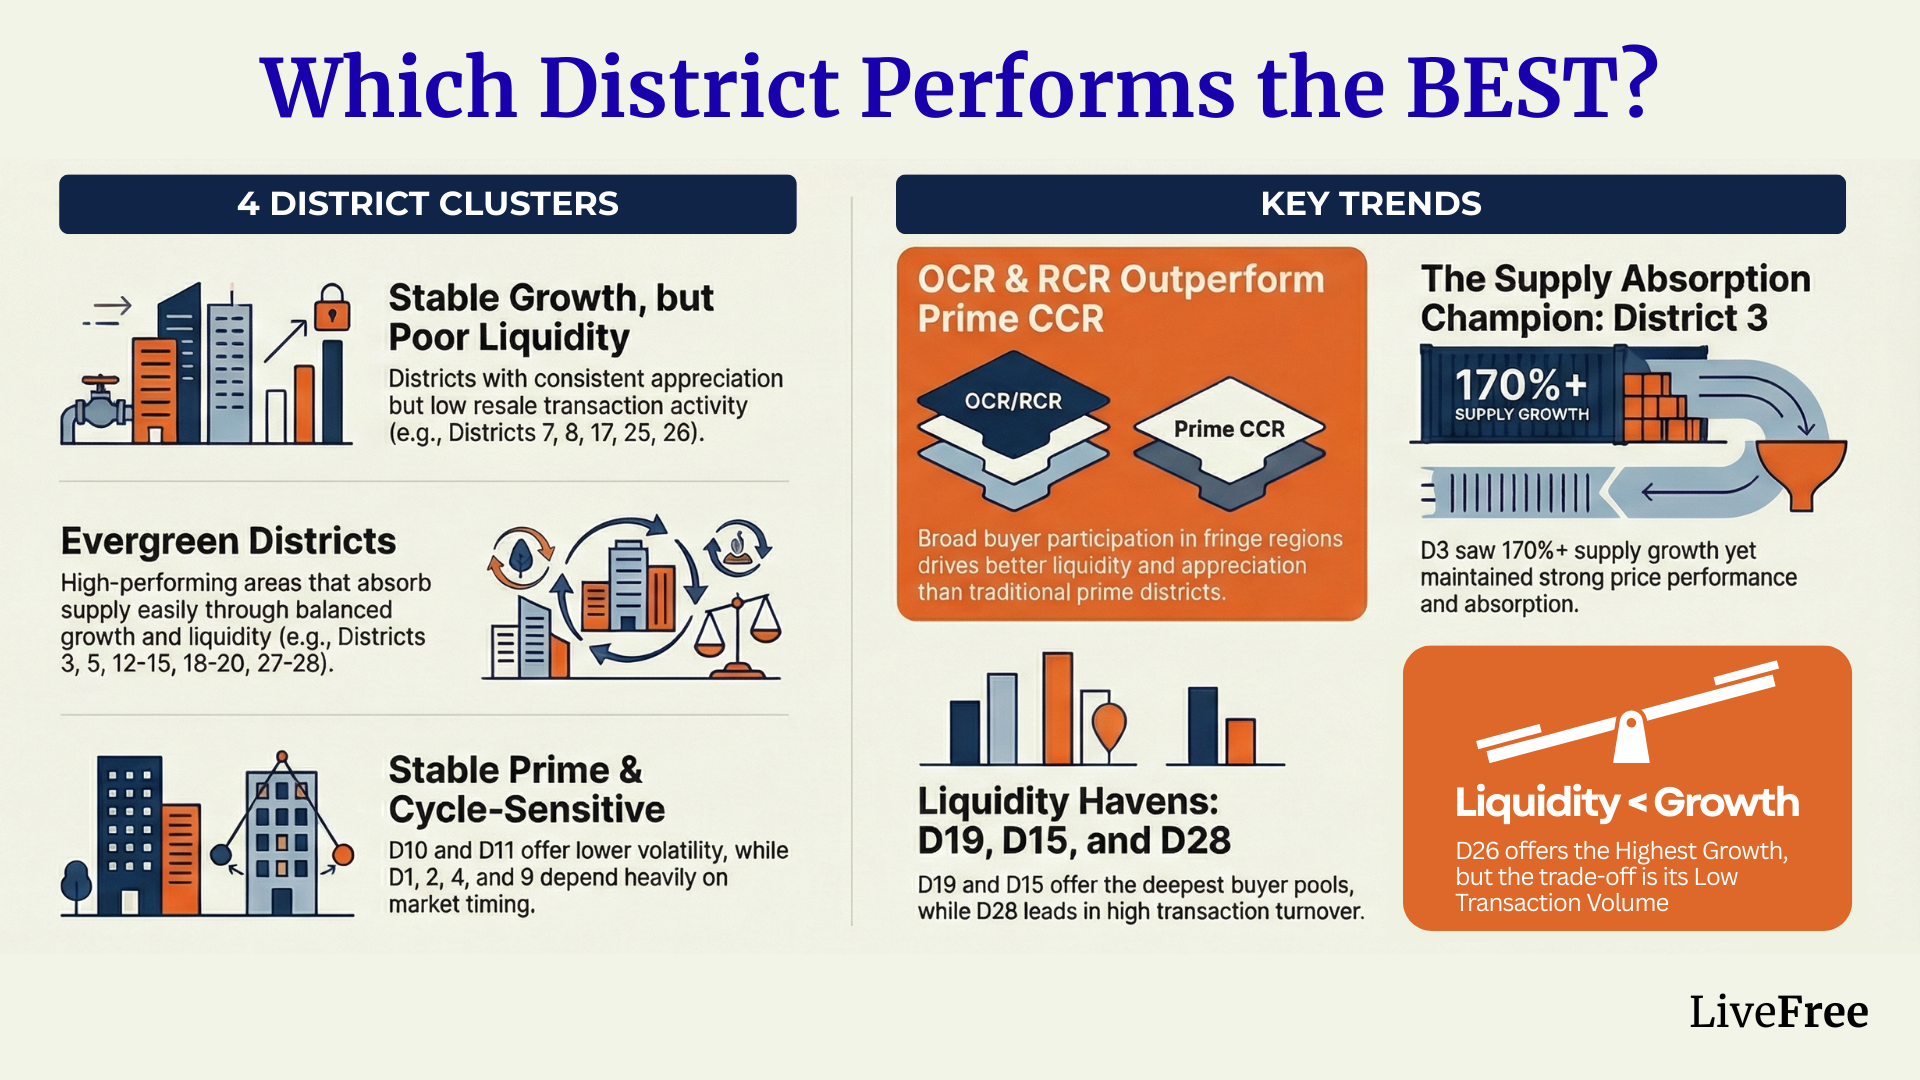
District 3 is the clearest case. Private housing supply expanded by more than 170%, and resale prices still rose meaningfully. D5, D15, D18 and D20 also absorbed significant additions without sharp disruption.
Conversely, districts with lower supply growth but narrower buyer pools produced more uneven outcomes. Supply hurts most when it is misaligned with demand, not when it is simply high. The same logic explains why project scale matters, which we covered in the boutique condo analysis.
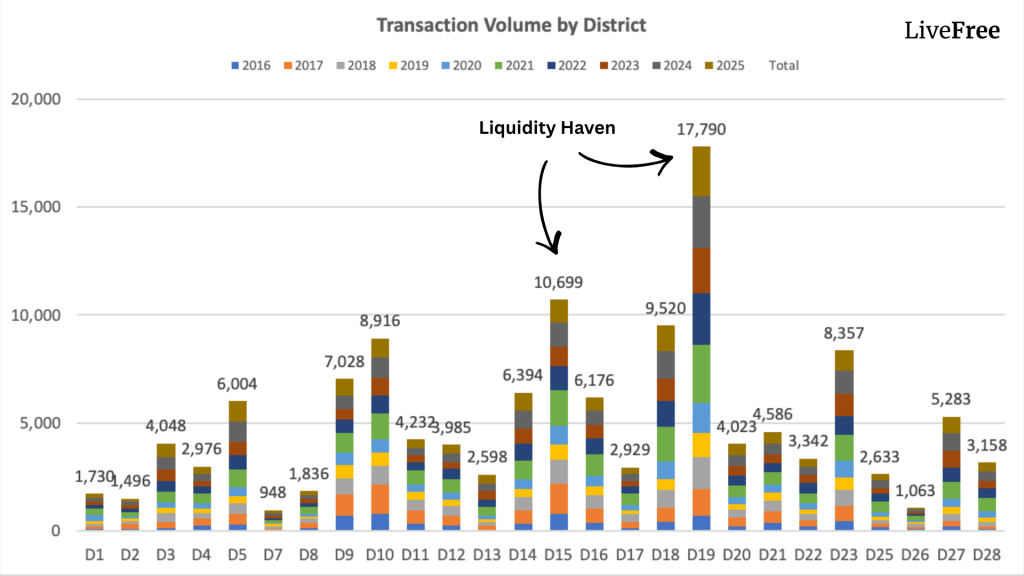
Supply explains how prices are supported. In judging the best performing district, liquidity determines how easily value can be realised when conditions soften or personal plans change. Price growth alone does not capture the buyer experience.
D19 and D15 consistently recorded the highest resale transaction volumes, indicating deeper buyer pools. At the other end, D26 showed strong appreciation on far fewer transactions, and D1, D2, D4 and D7 all ran lower volumes. Our District 15 family guide looks at what that depth means on the ground.
Lower liquidity does not mean poor performance. It means fewer active buyers at any moment, potentially longer holding horizons, and much greater importance on entry price discipline. Strong growth with thin liquidity simply suits a different risk profile.
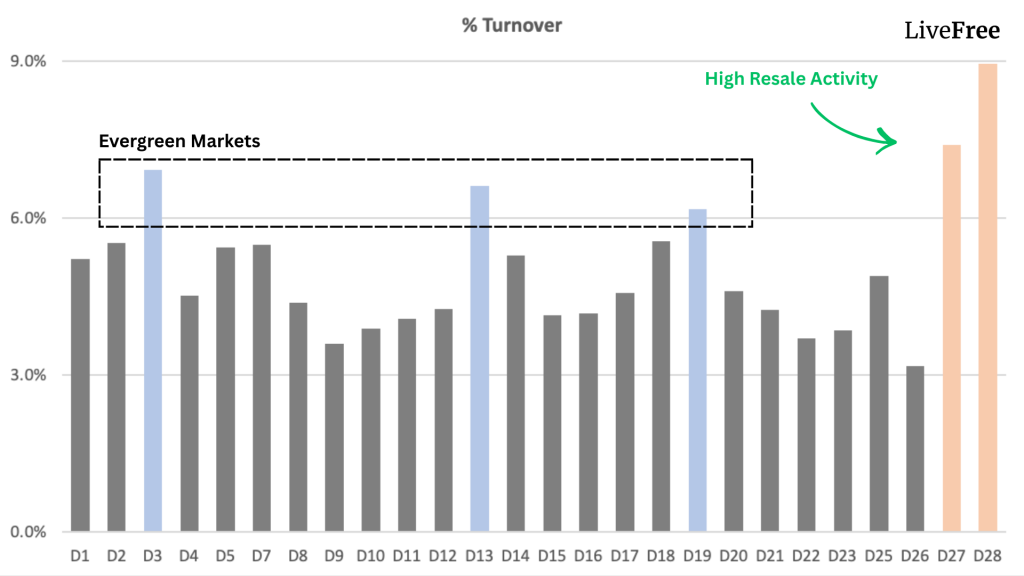
Turnover is the last lens on the best performing district question. It measures how often homes change hands relative to total supply. Districts 27 and 28 recorded the highest rates, alongside significant supply injection, consistent resale absorption and positive price movement.
Price accessibility was the key factor, supporting strong participation from HDB upgraders and replacement buyers. Higher turnover tends to appear where entry prices stay accessible, buyer pools are broad rather than niche, and upgrader demand is sustained.
This reinforces how central owner-occupiers and upgraders have been to resale activity this cycle, which is the same pattern running through our HDB upgrading roadmap.
Rather than naming a single best performing district, the data groups them into functional profiles:
The clearest lesson from ten years of resale data is that there is no universally best performing district, only districts that fit different strategies.
This is why two buyers can purchase in the same year and end up with very different outcomes. Data does not replace judgment, it sharpens it. District performance defines the terrain, but project selection, unit attributes and entry price discipline decide the result, which is why we also track unit-type demand and tenure.
The best performing district depends on the measure. Over ten years, D20 and D26 led on price growth and D27 on the five-year window. But D26 achieved its growth on thin transaction volume, so the answer depends on whether you value appreciation or the ability to exit.
Not structurally. D1, D2, D4 and D9 are cycle-sensitive, with strong rental demand and resale outcomes that hinge on entry price and timing. This particular cycle rewarded affordability and upgrader participation instead.
Not reliably. District 3 absorbed over 170% supply growth while resale prices still rose. Supply matters most when it is misaligned with demand rather than simply high.
D19 and D15 consistently record the highest resale transaction volumes. Districts 27 and 28 show the highest turnover relative to supply, largely because entry prices stayed accessible. For where new supply is landing next, see our 2026 launch shortlist.
They rarely coincide. Cycle-sensitive prime districts carry the strongest rental demand while growth this cycle sat in OCR and city-fringe. Our rental yield guide and the 2025 market review cover both sides.
Not sure which district type fits your goals? Contact Kelvin on WhatsApp — a question costs nothing.
Hi 
We offer private property consultations for readers. Interested?