

The Singapore property market 2025 closed with private home prices up 3.3%, the slowest annual growth since 2020, while new home sales jumped 67% to 10,815 units and unsold inventory fell to a 30-year low. Slower price growth against stronger demand and thinner supply is the combination that shapes 2026.
This is a data-led review. The first four sections stay strictly with the published statistics: price movements, transaction volumes and supply conditions across the private and public markets. Interpretation is deliberately held back to the final section, where we set out what the numbers may mean for buyers in 2026.
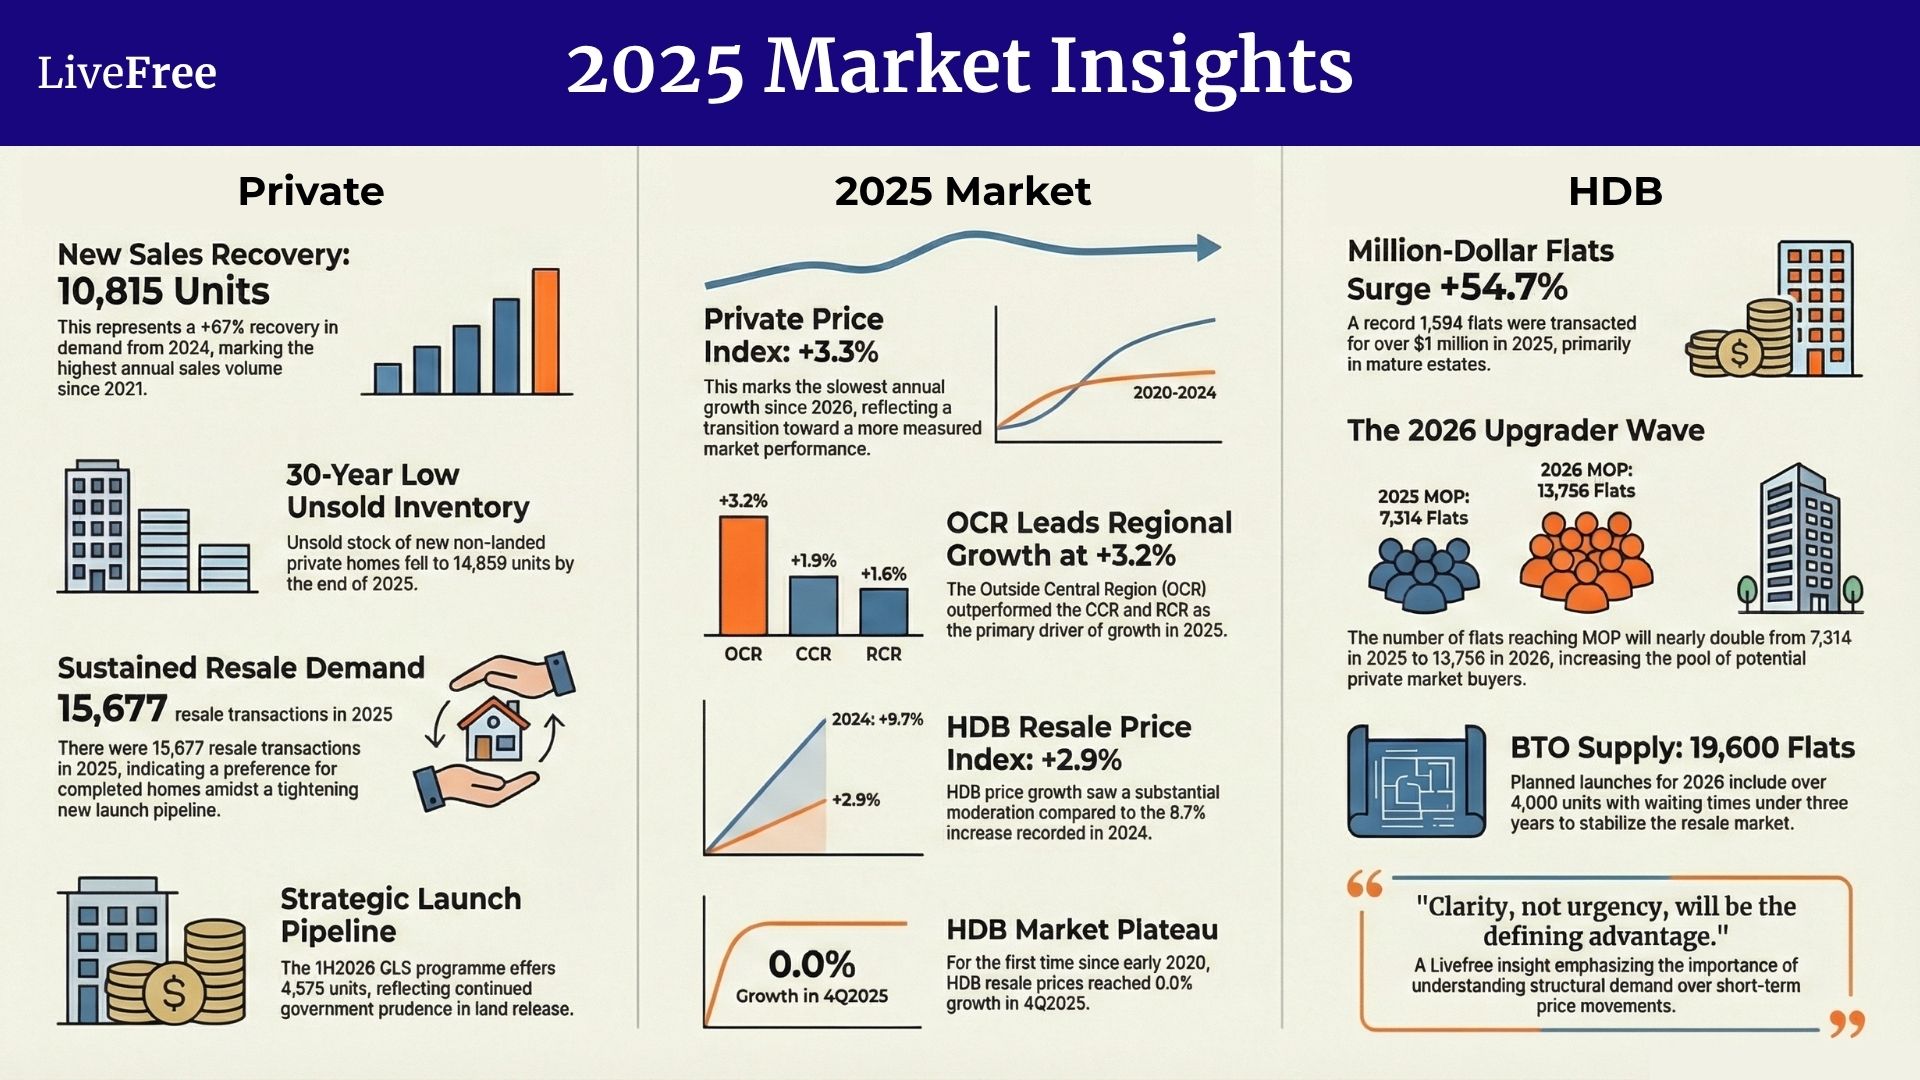
Singapore’s private residential property price index rose 3.3% in 2025, down from 3.9% in 2024 and the slowest annual gain since 2020.
That moderation is not weakness. It reflects a market moving away from broad-based acceleration toward something more measured and more segmented, shaped by disciplined developer pricing and by structural supply management through the Government Land Sales programme.
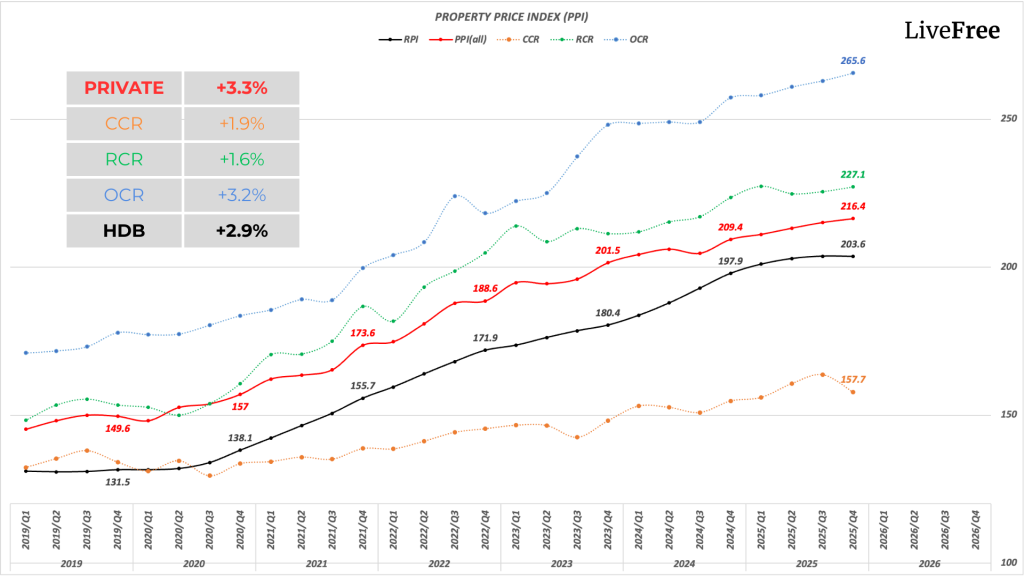
OCR leading the table is the single most important line in this review. It tells you demand is being set by upgraders and affordability, not by luxury buyers. Our ten-year study of district performance shows how persistent that pattern has been.
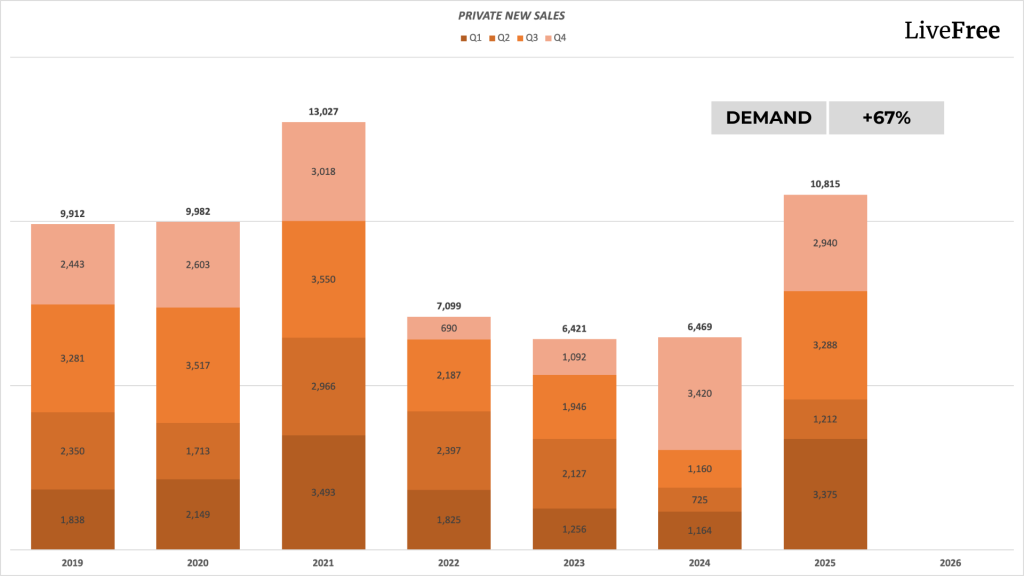
Developers sold 10,815 new private homes in 2025, excluding ECs, a sharp recovery from 6,469 units in 2024 and the highest annual volume since 2021. Three things supported the rebound:
For which projects drove that volume, see our 2026 new launch shortlist.
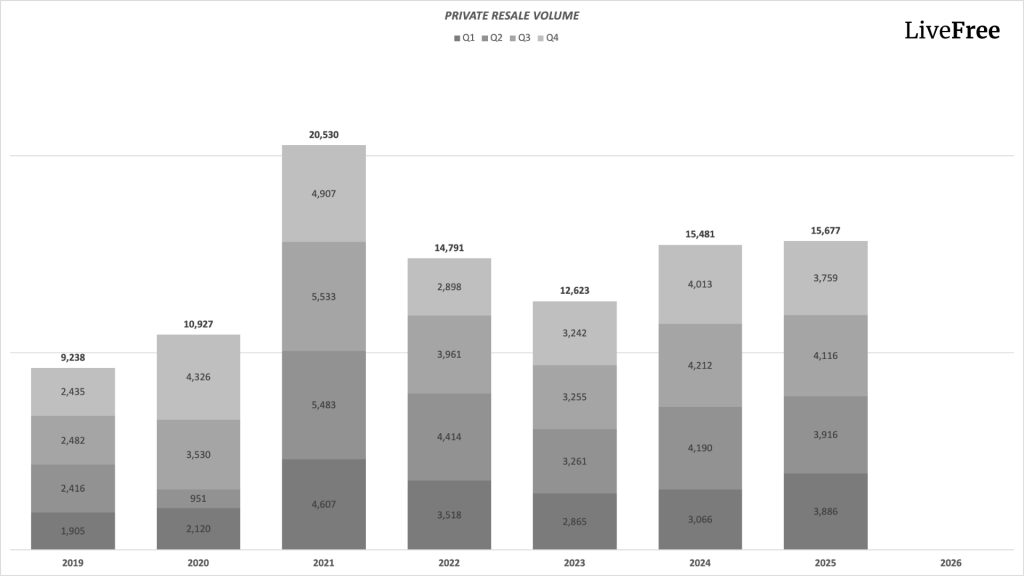
Resale activity edged up to 15,677 transactions, against 15,481 in 2024, which suggests demand for completed homes held firm even as the primary market recovered. Buyers weighing the two routes should read our subsale and resale comparison.
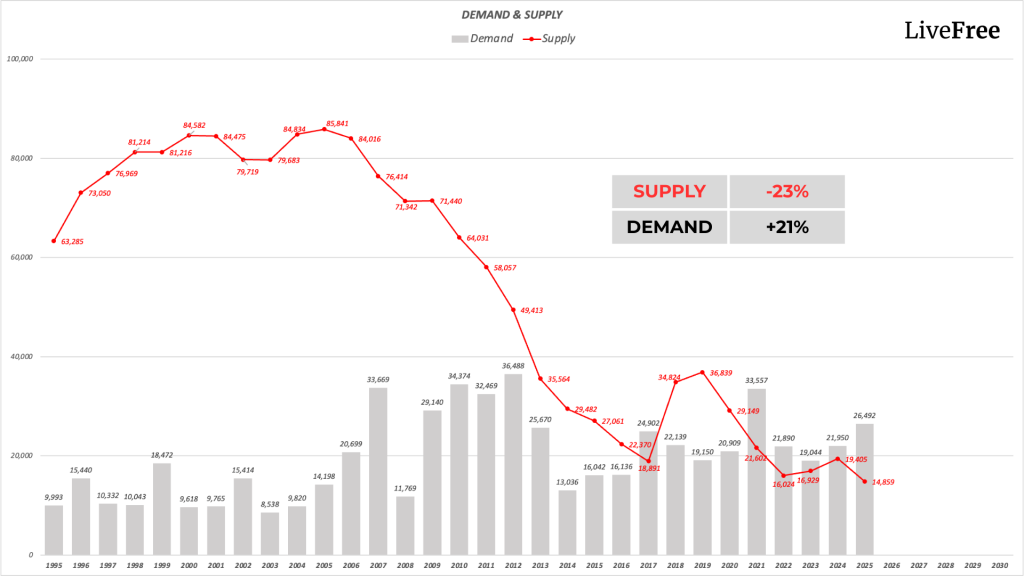
Unsold inventory of new non-landed private homes finished 2025 at 14,859 units, one of the lowest levels in over 30 years. That number matters more for 2026 pricing than anything else in this review.
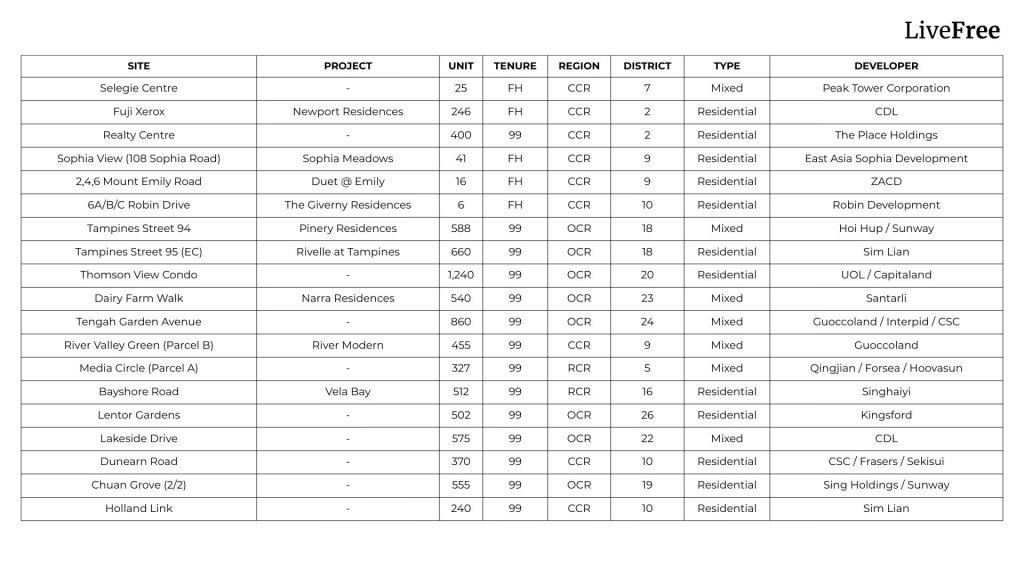
The GLS Programme for 1H2026 offers 4,575 units including EC supply, slightly below the 2H2025 pipeline, which signals continued prudence in land release against an already tight market. We break down the sites in the 2026 GLS land bids and the 2H 2026 hotspots.
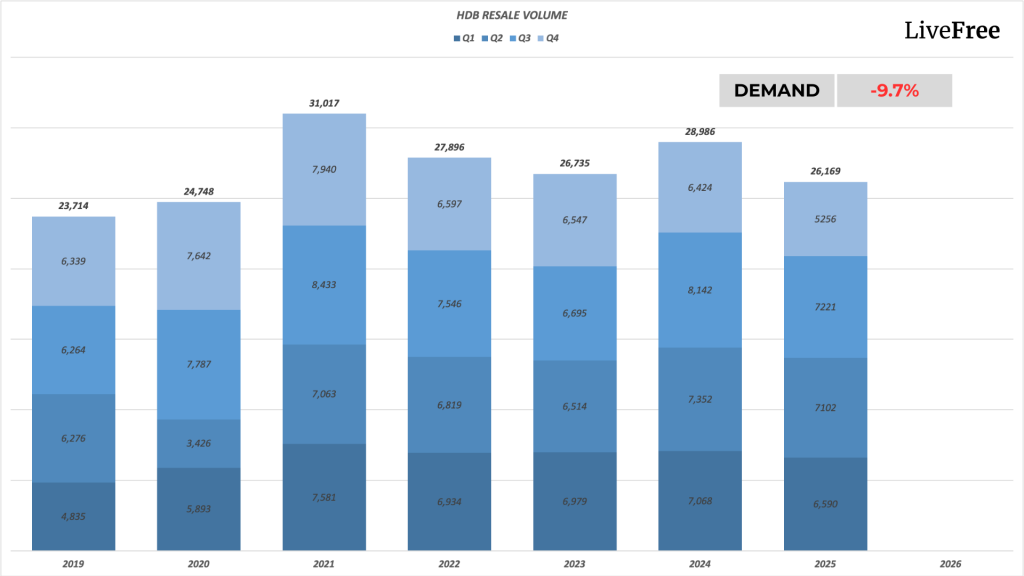
The HDB resale market hit an inflection point in 4Q2025, with prices flat at 0.0% growth for the first time since early 2020. Across the full year, resale prices rose 2.9%, a substantial moderation from the 9.7% recorded in 2024.
Volumes fell from 28,986 transactions in 2024 to 26,169 in 2025, down 9.7% year-on-year. Two causes:
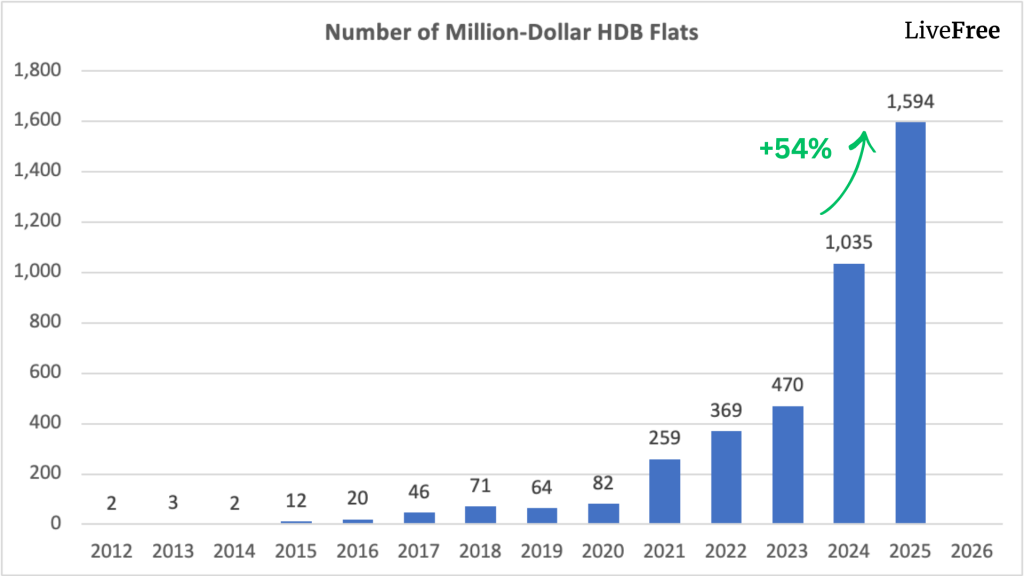
The top of the HDB market went the other way. A record 1,594 million-dollar flats changed hands in 2025, up 54.7% on the previous peak of 1,035 in 2024. More than half were flats aged 15 years or below, concentrated in mature estates with strong connectivity.
If you own one of these, the opportunity cost of holding is now substantial. We put numbers to it in the real cost of holding your HDB.
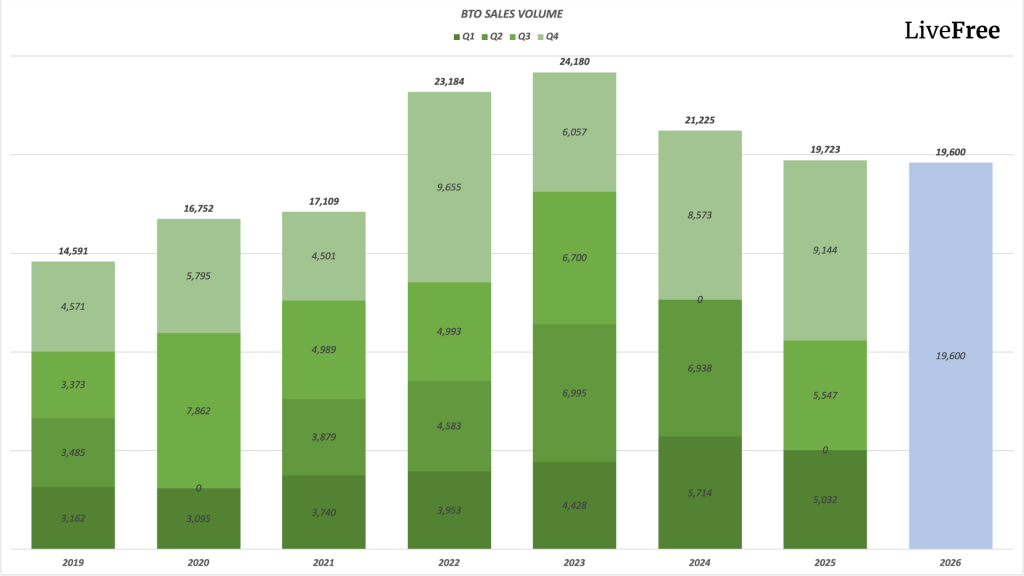
The government plans roughly 19,600 BTO flats across three 2026 exercises, with more than 4,000 units carrying waiting times under three years.
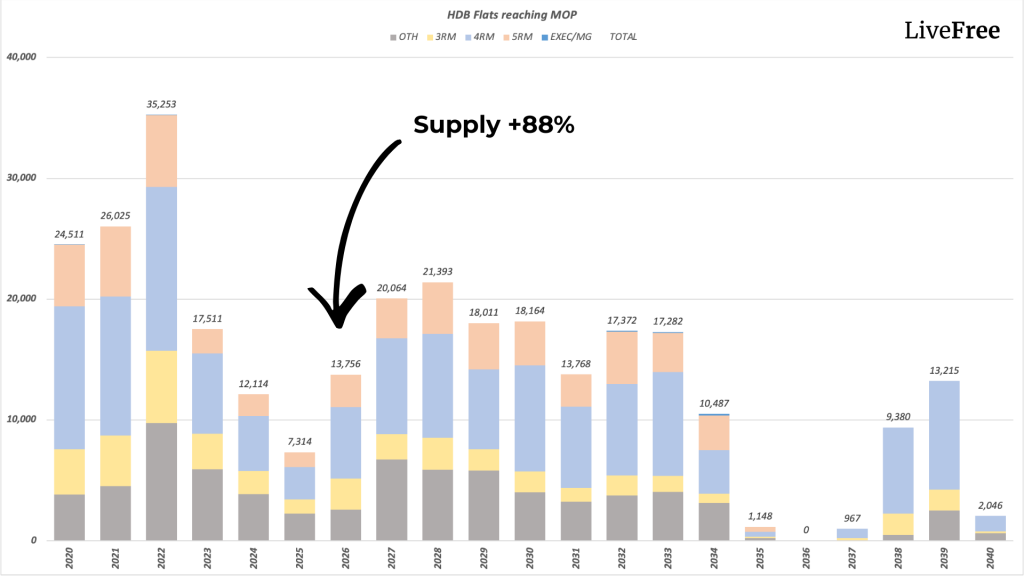
At the same time, flats reaching MOP nearly double, from 7,314 in 2025 to 13,756 in 2026. That upgrader wave arrives just as new launch choice narrows. Our HDB upgrading roadmap sets out the sequence, and the EC route is worth weighing if the budget is tight.
The 2026 pipeline is more balanced but narrower, with a greater proportion of large developments, and fewer genuinely popular options than 2025 offered.
That reflects the cumulative effect of controlled land release, heavy absorption through 2024 and 2025, and today’s thin unsold inventory. Choice rather than price may be the binding constraint, which makes unit type and tenure decisions sharper. see what ten years of data say about unit types and our 99-year versus freehold comparison.
The data above is descriptive. Read collectively, several structural patterns emerge.
If these conditions hold, 2026 is less a story of broad price acceleration and more a question of where demand concentrates, which segments benefit, and how limited choice reshapes behaviour. For how this actually played out, read our Q1 2026 review and Q2 2026 review.
In a market where headlines chase short-term price movements, structural demand, supply depth and buyer flow matter far more than momentum. Property is a long-hold, leveraged asset, a point we argue in full in property versus stocks.
The private residential price index rose 3.3%, down from 3.9% in 2024 and the slowest annual growth since 2020. HDB resale prices rose 2.9%, against 9.7% in 2024.
Outside Central Region, at +3.2%, the strongest non-landed segment. CCR rose 1.9% and RCR 1.6%.
Volumes dropped 9.7%, from 28,986 to 26,169, mainly because BTO launches with shorter waiting times absorbed demand and because flats reaching MOP fell to an 11-year low of 7,314 units.
Unsold inventory ended 2025 at 14,859 units, one of the lowest readings in 30 years, and the 1H2026 GLS programme adds only 4,575 units. Choice is narrower than in 2025. See the 2026 launch shortlist.
Flats reaching MOP nearly double to 13,756 in 2026, so more owners become eligible at once, which means more competition for the same narrow pool of launches. Planning early matters more than usual; start with the upgrading roadmap.
Planning your next move in 2026? Contact Kelvin on WhatsApp — a question costs nothing.
Hi 
We offer private property consultations for readers. Interested?